Debugging A Memory Leak In Python
I recently ran into a memory issue with Python: a long-running script would use more and more memory until the kernel would eventually kill it. Python doesn’t have “memory leaks” in the same sense that lower level languages do, but it is possible to tie up memory by maintaining a reference to it somewhere that you forgot about. As it turns out, there are some awesome tools for troubleshooting this kind of bug in Python.
Define “Leak”
The script in question is a websocket client that connects to a server and downloads some data. The client loads each message from the server and stores it in a database. It should not keep old messages in memory, so it should be very memory efficient.
I have a copy of both the server and client running locally on my machine, and after a few minutes of executing, the client is using almost 1GB. If I let it run longer, the kernel will eventually kill it. This happens reliably every time.
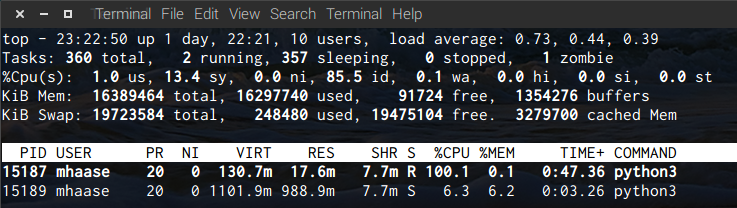
top while the client and server are running.What could possibly be going on?
Modern CPython (version 3) cannot “leak” memory in the typical sense of the term: all
Python objects are automatically reference
counted and are freed when the
reference count hits zero. Python also has a garbage
collector to handle freeing of objects with
cyclical references. Older versions of Python would not garbage collect objects with a
__del__ method, but even that has been
fixed as of Python 3.4.
The short story is that if you think you have a memory leak in Python, you probably do not have a memory leak in Python!. (Foreshadowing alert!)
So what could be the cause of my program running out of memory? The only way to truly
leak memory in Python is via an extension module, e.g. a module written in C. Such
modules must performance reference counting manually (e.g. Py_INCREF(PyObject *o)) and
any mistakes in reference counting could lead to a memory leak.
It is also possible to simply keep a reference to an object by mistake. Although this is
not a “leak” in the true sense, it can behave like one. For example, if you have a
global dict() object that you use as a cache, any objects referenced by that dict()
will never be freed, any objects referenced by those objects will never be freed, etc.
(If you want to cache objects without preventing them from being freed, consider a
WeakValueDictionary
instead.)
Profiling
In my case, my script was not using any unusual extension modules, so I figured that was an unlikely source. My script is implemented as a single main class with no other global variables. The main class itself does have a few members that contain collections of cached objects, but I reviewed the code for collections carefully, and I was pretty sure that those were not the source of the leak.
I spent some time trying to comment out different sections of my code, to see if any one section could be the cause of the memory leak. To my frustration, the leak was impossible to pin down. A few permutations of commented out lines would prevent the leak, and a few other permutations would slow down the leak but not prevent it entirely, but I could not narrow it down to a single, specific function.
So now what?
This is where two awesome Python tools come in: Pympler and objgraph. Pympler is a heap analysis tool, and objgraph renders visualizations of object references. I found a few articles explaining how to use objgraph, one written by the author of the library himself, but they were both out of date.
So, let’s start with Pympler. I opened a REPL and started running my websocket client
for a bit. I watched the process in top and then canceled it when it had gained about
60-70MB in memory usage. Now, in the same REPL, I used Pympler to profile the heap.
>>> # I've already run my websocket client for a bit...
>>> from pympler import muppy, summary
>>> all_objects = muppy.get_objects()
>>> len(all_objects)
206657
>>> sum1 = summary.summarize(all_objects)
>>> summary.print_(sum1)
                                           types |   # objects |   total size
 =============================================== | =========== | ============
                                     <class 'str |      106160 |     63.26 MB
                                    <class 'dict |       10797 |      6.50 MB
                                    <class 'code |       15284 |      2.10 MB
                                    <class 'type |        2066 |      1.97 MB
                                    <class 'list |       12042 |      1.26 MB
                                     <class 'set |        2558 |    716.56 KB
                       <class 'collections.deque |         493 |    648.07 KB
                                   <class 'tuple |        7648 |    506.62 KB
                                 <class 'weakref |        4372 |    341.56 KB
   <class 'sqlalchemy.sql.visitors.VisitableType |         214 |    216.12 KB
                                     <class 'int |        6750 |    185.75 KB
                             function (__init__) |        1155 |    153.40 KB
                       <class 'getset_descriptor |        1801 |    126.63 KB
                      <class 'wrapper_descriptor |        1199 |     93.67 KB
                               <class 'frozenset |         124 |     87.88 KB
The output from Pympler shows that I have over 100k strings in my program, cumulatively
using 63MB of memory. My program shouldn’t be creating this many strings, and the memory
usage is a close match for the amount seen in top–the “leaked” amount as it were.
Next, I started randomly sampling from these strings to see if I could find any strings
that I didn’t expect to be there.
>>> strs = [ao for ao in all_objects if isinstance(ao, str)]
>>> len(strs)
106160
>>> print(strs[0][:33])
The most base type
>>> print(strs[1000][:33])
TextIOWrapper
>>> print(strs[100000][:33])
{"data": {"thread_link": "http://
Aha! At strs[100000], I find a string that contains JSON data, corresponding to a
message that my websocket client is supposed to process and store in a database. I can
now check in the database to see if this particular message has already been processed,
and it appears that it has not been processed, which deepens the mystery: why is this
unprocessed message sitting around in memory? Some more sampling confirms that a large
percentage of these strings are other JSON messages.
Visualizing References
This is where objgraph comes in. I want objgraph to show me what objects are referencing
this string: this tells me what objects are preventing the string from being freed. This
gets a little tricky, because in the process of debugging, I have created additional
references to the string, for example the strs list above. We just need to keep this
in mind as we analyze.
>>> o = strs[100000]
>>> objgraph.show_backrefs(o, filename='json_str_backrefs.png')
This draws an object graph with GraphViz and saves it to a file. I’ve cropped out some irrelevant parts, and you can click to view full size.
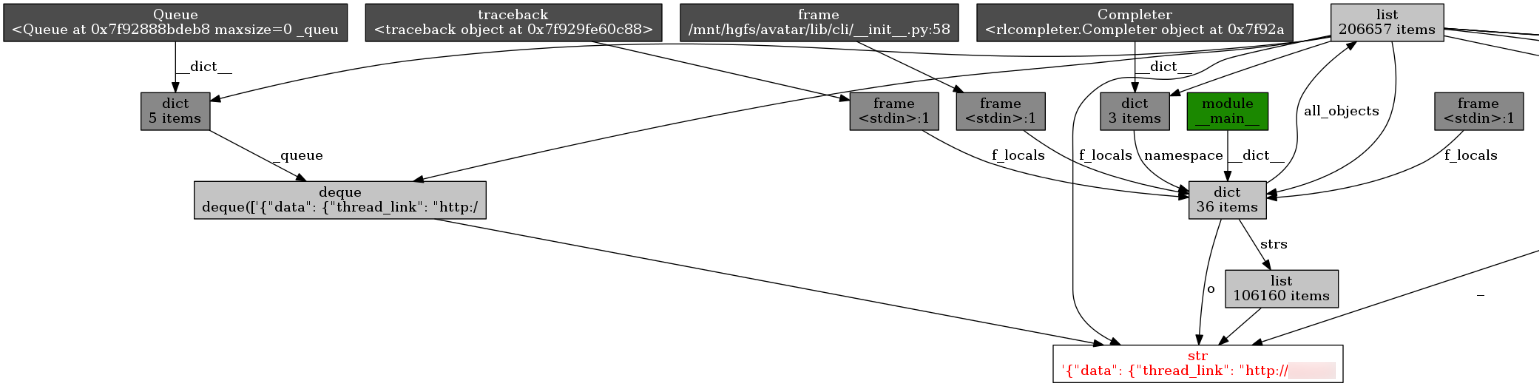
There’s a lot going on here, so let’s try to make sense of it. Each object is drawn as a
box, and each arrow points from the referrer object to the referee. For example, the
dict near the middle (with 36 items) appears to be my locals().
>>> len(locals())
36
Yep. It refers to some of the objects we made above while debugging, such as
all_objects, strs, and o. The JSON string itself is displayed in red text at the
bottom. Most of the backreferences are uninteresting because they are objects that we
created for debugging. (I cropped out one irrelevant backreference, but you can still
see the arrow coming in from the right side.)
The interesting backreference is from an object called _queue, which is a member of an
instance of Queue. This sounds promising: is something in our application putting
strings onto a queue and then never retrieving them? I do not use any queues in my code,
so the answer to this question is not obvious to me, yet. Therefore, I want to look at
backreferences for the Queue instance.
>>> qs = [ao for ao in all_objects if isinstance(ao, asyncio.Queue)]
>>> len(qs)
1
>>> hex(id(qs[0]))
'0x7f92888bdeb8'
>>> q = qs[0]
>>> objgraph.show_backrefs(q, filename='queue_backrefs.png')
Note that the hex address matches the object seen in the graph above, so we know we are looking at the same object. Again, I cropped out some irrelevant parts of the object graph.
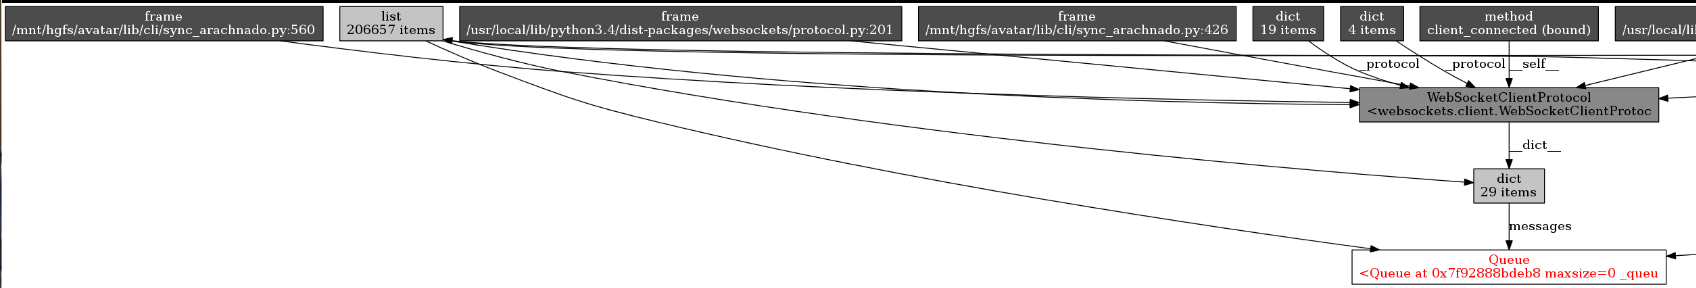
The queue is referred to by an instance of WebsocketClientProtocol, which is
defined in the websockets.client module–that’s a third party library I’m
using. Wait, what?!
Solution
It turns out that this is a bug in the websockets library. It does not implement flow control when reading from a websocket. If the server sends messages faster than the client can handle them, the client will buffer incoming messages in memory. It does this without limit, to the point that the kernel eventually kills the process.
This revelation explains why commenting out lines of code could not pinpoint the source of the leak: the “leak” was caused by the client running slower than the server. It didn’t matter exactly which lines of code were commented out, as long as you commented out a few expensive operations, the client would run fast enough to keep up with the server, and it would not “leak” memory. In other words, this issue would have been nearly impossible to debug without Pympler and objgraph.
What’s the moral of the story? If you think you have a memory leak in Python, you probably do not have a memory leak in Python!.